Preface
Traceroute is a handy network diagnostic tool that helps you understand the path your internet data takes from your computer to a destination server. Whether you’re troubleshooting network issues or just curious about the route your data follows, knowing how to run a traceroute can be quite beneficial. In this guide, we’ll walk you through the process of how to run a traceroute on macOS, Linux, and Windows systems. No matter your operating system, you’ll be equipped to investigate network problems and gain insights into your internet connection.
What Is the Meaning of Traceroute?

Traceroute is a command-line tool employed to trace the route that data packets take across a network. It provides valuable information about each hop (router or server) your data encounters along the way to its final destination. By displaying the IP addresses and response times of each hop, traceroute helps identify potential bottlenecks or network issues affecting your connection. Now, let’s delve into how this tool operates on different operating systems.
How Does Traceroute Work?

Traceroute is like a digital explorer, embarking on a journey to map out the path your data takes across the vast expanse of the internet. When you initiate a traceroute, you’re essentially sending out probes, called packets, to trace the route from your device to a specified destination, be it a website, server, or any other endpoint. These packets hop from one router to another, each time gathering valuable information about the route they travel. By measuring the time it takes for each packet to reach its destination and recording the IP addresses of the routers it encounters along the way, traceroute builds a detailed roadmap of your data’s journey. This roadmap, or traceroute, helps you pinpoint any bottlenecks, delays, or network issues that may be affecting your connection.
How to Run a Traceroute?

Running a traceroute is a simple yet powerful way to gain insights into your network connectivity. Whether you’re troubleshooting a slow internet connection or just curious about the path your data takes, here’s how you can run a traceroute on various operating systems.
Run a Traceroute on Linux
If you’re using a Linux-based operating system like Ubuntu, running a traceroute is as easy as pie. Just open your terminal & enter:
traceroute [destination]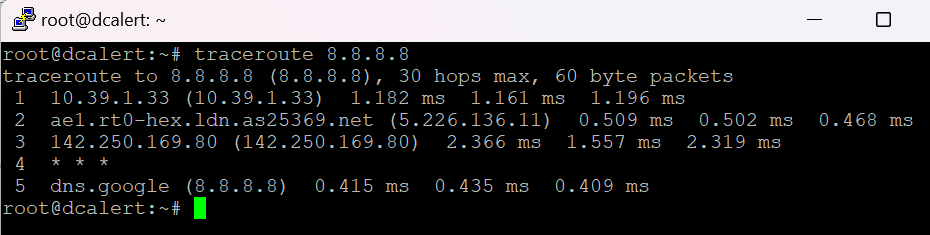
Replace [destination] with the domain name or IP address you wish to trace. Hit enter, and watch as the traceroute command springs into action, revealing the hops your data makes on its journey to the destination. With traceroute Linux, you can quickly identify any network issues and troubleshoot connectivity problems like a pro.
Traceroute is a vital element for network diagnostics on Linux systems. Whether you’re a seasoned sysadmin or a curious user, mastering the traceroute command for Linux opens up a world of possibilities. By understanding the route your data takes, you gain valuable insights into your network infrastructure and can swiftly pinpoint any bottlenecks or anomalies affecting your connection. Armed with the Linux command traceroute, you can confidently navigate the complexities of the internet and ensure optimal performance for your system.
Run a Traceroute in Windows
Windows users fear not! You too can wield the power of traceroute with the tracert command. Simply open the Command Prompt and type:
tracert [destination]Similar to its Linux counterpart, replace [destination] with the target address you wish to trace. Hit enter, and Tracert will begin its quest, unraveling the mysteries of your network path one hop at a time. With traceroute windows, you’ll be equipped to diagnose network issues and optimize your connection with ease.
Tracert is the go-to tool for network troubleshooting on Windows systems. Whether you’re troubleshooting connectivity problems or analyzing network performance, the trace route windows command provides valuable insights into your network topology. By tracing the route your data takes, you can identify potential bottlenecks, latency issues, or packet loss, allowing you to take proactive steps to improve your network’s efficiency and reliability.
Run a Traceroute on macOS
For those in the macOS realm, fear not, for traceroute is at your fingertips as well. Open the Terminal application and enter:
traceroute [destination]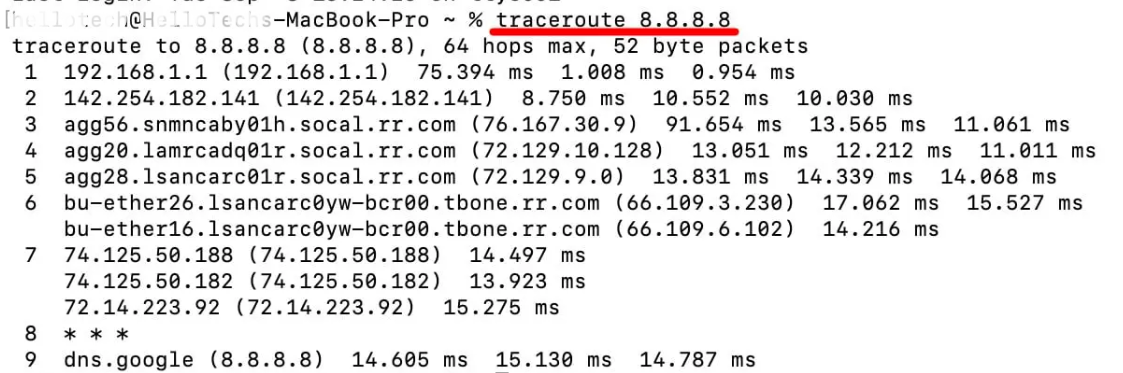
Once again, replace [destination] with the domain name or IP address of your choice. Press enter, and let traceroute on macOS illuminate the path your data takes, empowering you to troubleshoot network problems and ensure a smooth browsing experience.
Traceroute on macOS is a powerful tool for diagnosing network issues and optimizing connectivity. Whether you’re a developer, sysadmin, or everyday user, the ability to trace the route your data takes provides valuable insights into your network’s performance. With the traceroute command for macOS, you can identify potential bottlenecks, troubleshoot connectivity problems, and ensure optimal performance for your Mac system. So next time you encounter network issues, don’t fret—just fire up the Terminal and let traceroute guide you towards a solution.
How to Read a Traceroute?

Understanding how to read a traceroute is essential for effectively diagnosing network issues and optimizing your internet connection. Here’s a breakdown of what each part of a traceroute output means:
Hop Number: Every line in the traceroute output signifies a hop along the route from your computer to the destination server. The hop number indicates the order in which the router or server was encountered.
IP Address: The IP address of each hop shows the network device your data packet passed through. You can employ this data to identify the routers or servers in the path.
Round-Trip Time (RTT): The RTT measures the time it consumes for a packet to move from your computer to every hop and back. Higher RTT values can signify network congestion or latency issues.
Hostname (Optional): Some traceroute outputs include the hostname of each hop, which can provide additional context about the network device.
Packet Loss: In some cases, traceroute may indicate packet loss at a particular hop. Packet loss can happen due to network congestion, faulty components, or other issues.
Also Read: How to Kill a Process in Linux Command – Complete Guide
Final words
Congratulations! You’ve learned how to run a traceroute on Linux, Windows, and macOS, and gained valuable insights into reading traceroute output. Armed with this knowledge, you’re equipped to troubleshoot network issues, optimize your internet connection, and navigate the complexities of the digital realm with confidence. It does not matter if you are an expert IT professional, a willing coder, or somewhere in between, traceroute is a powerful tool in your network diagnostic arsenal. So the next time you encounter connectivity problems or want to gain insights into your network infrastructure, don’t hesitate to fire up the terminal or command prompt and run a traceroute.
Remember, understanding how data flows through the internet empowers you to take control of your network and ensure a smooth online experience. Keep exploring, keep learning, and keep tracing those routes to digital enlightenment!