
Introduction
Just like a makeup box holds all the essential items needed for creating a makeup look—foundations, brushes, eyeshadows, etc.—a Docker container holds everything needed to run an application—code, libraries, settings, etc. A Docker container is like a home for an app, keeping everything it needs in one place, while Docker logs are like the notes the app writes about what it’s doing inside that home. Containers provide space for the app to run, and container log tails give us a peek into what’s happening while the app is running inside. Checking Docker container logs is crucial for maintaining the health, security, and performance of applications running within containers. It enables timely issue resolution, helps in optimizing resources, and ensures that the applications are running smoothly and securely. Through this article, you will get a wide view of how to check Docker logs.
How to Check Docker Container Logs?
Many times, we confuse between docker containers and docker container logs. The container is an application or software, and the logs are events recorded by that software. We have chalked out some major points that will help in checking the Docker logs.
Docker Logs Command
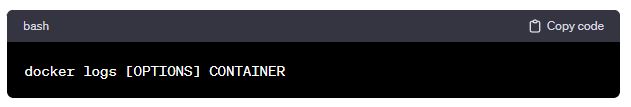
When it comes to getting an overview of logs, you can use the command to look into specific containers or logs. The below command will help you do so.
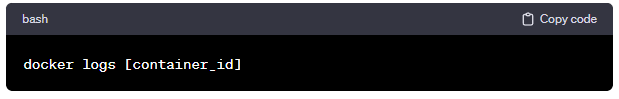
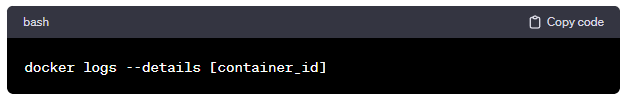
The following command will enable the detailing of a particular container.
Docker Logs Location
Whether you need information on any unauthorized access or want to check any anomaly in application behavior, the log’s location will tell you all about it. To check the exact file path or directory, simply use the following syntax:
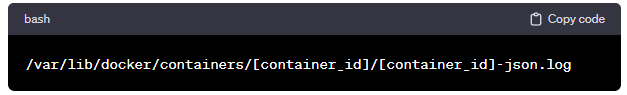
JSON is the default format the containers use to store the logs, which are recorded notes of all the activities. The above syntax specifies the specific location of the log stored inside JSON.
Extra Metadata
Metadata is all about collecting additional information on the log information, which generally consists of timestamps, formatting, and much more. If you are a developer, auditor, or simply a system administrator, you will need to have that extra minute detail on the presented log data.
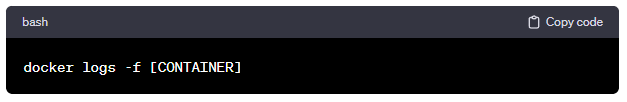
Enable Live Monitoring
This option is suitable for tracking ongoing updates within a container. Anyone looking for a quick solution to an issue or the smooth working of any application can take advantage of the live monitoring mode through the following command:
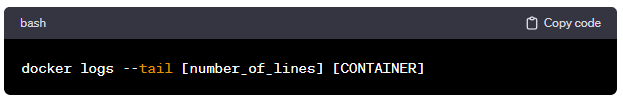
Tail Logs
It may seem that both the “follow” option and “docker logs tail” work on the most updated data. The reality lies between the last lines of the log, which are the major focus of the log tail and not the entire live stream of data. Use the below command to track every minute change in the last lines of the Docker log.
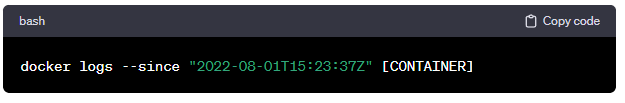
Show Logs Since
If your search is based on a certain time duration, then this is the best method to look at the minute details. You can use the “–since” option to set an absolute or relative period. For example, you can check the logs that came after August 1, 2022, at 3:23:37 PM in UTC with the following command:
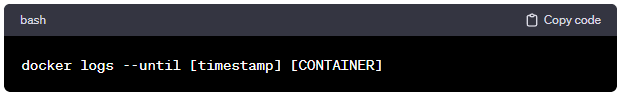
Until Option Usage
Just like the name suggests, this option is used to limit searches to a certain point in time. The option is very similar to the “since” option, but it does not have a starting point. You can use the “–until” option to get the data recorded before a certain period.
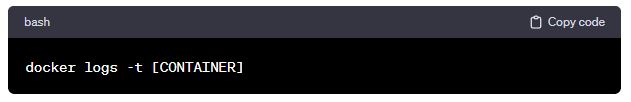
Display Timestamps
Timestamps are like those little notes that tell you about the exact point where something happened. In the Docker container logs, the timestamp serves as a label for any activity.
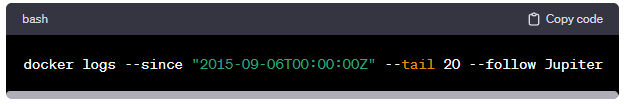
Combine Various Flags
Flags such as “tail” and “since” can be combined to get a more refined result. Look at the syntax below, which will fetch logs from the “Jupiter” container starting on September 6, 2015, and display the last 20 log lines. Also, it will continuously monitor output for new entries in real-time:
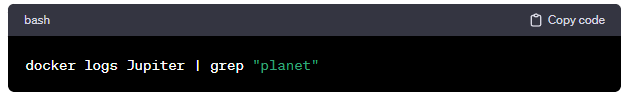
Filter With Shell Utilities
Piping is the use of the symbol “|” in the syntax. This symbol enables the joining of the output and input of two different commands. This means you’re directing the output stream of the first command directly into the input stream of the second command for further processing. Utilities like “grep” can be piped with a docker command to see container logs.
Also Read: nslookup Command: Meaning and Utilization
Summary
Much like how a makeup box organizes and contains all the tools needed for makeup, Docker containers package and encapsulate everything necessary to run an application. Docker logs serve as a vital window into understanding what’s happening within Docker containers, much like the detailed notes that an application writes while it’s running. They provide crucial insights into an application’s behavior, errors, security issues, and performance. By leveraging various commands and options such as docker logs, –since, –tail, and shell utilities like grep, users can effectively track, filter, and monitor logs based on specific criteria or search terms. This insight into container activity is invaluable for maintaining application health, swiftly resolving issues, optimizing resource usage, and ensuring secure and smooth application operations within Docker environments.


